
In the world of music administration, access to accurate and actionable data is crucial for making informed decisions.
Having data you can rely on and understand ensures the smooth operation of music services, hubs, and peripatetic teachers. Once you’ve got your data, you’ll need a tool that can pull this at the touch of a button which Xperios, Paritor’s music administration software, can do.
But what next? This is where Business Intelligence (BI) reporting tools come into play. There are a range of these on the market, but in this blog we’ll be using Microsoft’s Power BI. With it’s robust features and seamless integration with Paritor’s Xperios, Power BI empowers it’s users to transform the raw data into meaningful insights.
In this blog post we’ll explore the following topics in more detail, giving you all the information you need to take the next steps with BI reporting tools.
Why rely on BI reporting tools
One of the primary reasons music administrators turn to Bi reporting tools like Power BI is the ability to visualise and analyse data effectively into coherent, visually immersive insights. Xperios provides a range of queries within its dashboard, offering comprehensive insights into the overall performance of the music service. For instance, administrators can easily view the number of pupils in tuition, what they’re studying, their gender, ethnicity, pupil premium status, all of the essentials for a board report or even the dreaded ACE return. What’s more, reports on lesson delivery, staff absences, pupil attendance and resource management can all be pulled. But the data in its raw form can take hours to interpret, analyse, and identify trends. What if you could see how the data relates to each other across the board? That’s where BI reporting tools become invaluable.
BI reporting tools bring unique features and tools that make it particularly useful for our customers. Its intuative and interactive visualisations allow users to explore data effortlessly, revealing patterns, trends and correlations that may have otherwise remained hidden. With Power BI’s drag and drop functionality, users can create custom reports and dashboards tailored to their specific needs. Whether it’s tracking gender trends for activities, location of lessons, or pupil ages, BI reporting tools provide a comprehensive solution for visualising and analysing music administration data.
Enhancing Data Analysis
Compared to traditional spreadsheets of data, using BI reporting tools offers numerous advantages in terms of data analysis. For example, Power BI enables real-time data updates and dynamic visualisations, ensuring that administrators are working with the most current information. The integration of BI reporting tools with Xperios through API keys ensures secure data transfer, safeguarding ever sensitive pupil information. Moreover, Power BI’s ability to handle large datasets and perform complex calculations simplifies the analysis process, saving valuable time and effort!
The interactive nature of BI reporting tools allows services to drill down into specific data points like never before, gaining deeper insights into their music programmes, and enabling data driven decisions to be made. In the example below, we’ve connected to the Xperios report Pupils in Tuition as of Today. With this report users can see a range of data about their pupils such as gender, year group, ethnicity, home address, and what they are studying. Once you’ve connected your BI reporting tool to your data (using an API key for Xperios queries) and converted it into a table you can select the columns of data that you’re going to report on. The next step is to use the built in visualisation models within your BI reporting tool to create your dashboard, as below.
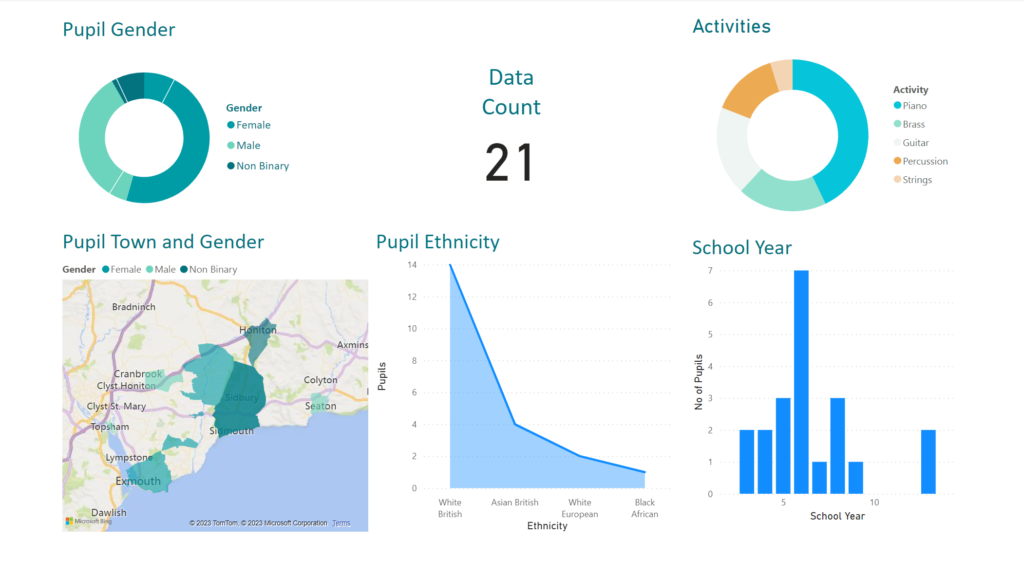
On it’s own, the BI reporting tool dashboard clearly illustrates your data in an easy to view way. But that’s only half the story. By clicking on one of the visualisations on the dashboard, the rest of the them automatically display information related to what you’ve selected, as below. For example, on the dashboard above, if you click on the gender and select Female, all the visualisations show data relevant to just the female students. Users can see:
- how many female students they have in tuition,
- their ethnicity,
- their year group,
- where they live,
- what they study.
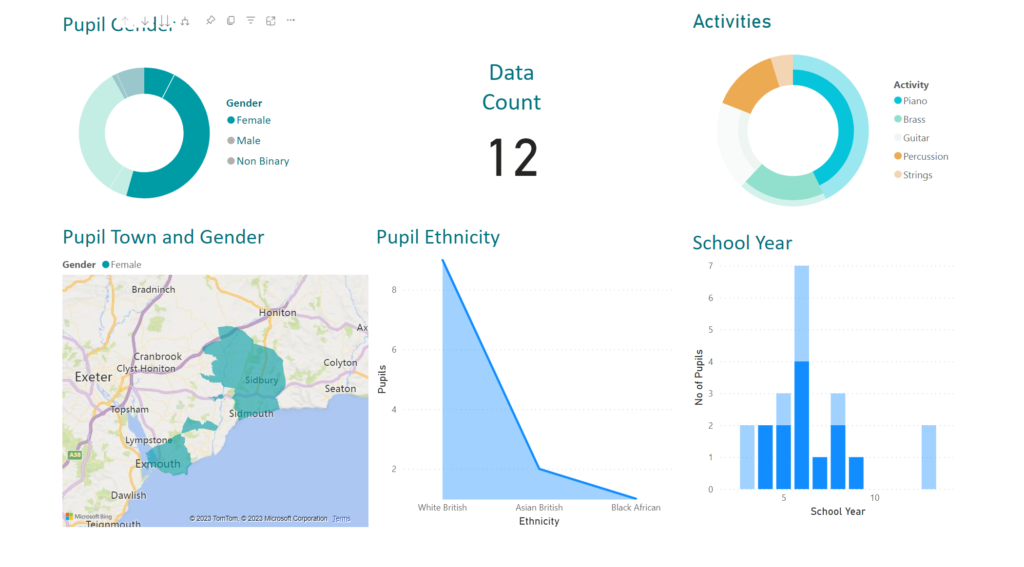
All at the touch of a single button. There’s no longer the need to scroll through various reports, adding filters and counts, and manually trying to establish the information. This can now be seen in an instant. What’s better, once the report is saved all you need to do is press the refresh button at the top the next time it’s loaded, and you’ll see the most up to date information. No need to run the query again in Xperios, or recreate a spreadsheet. Think of the administrative time a BI reporting tool can save.
The Benefits of BI reporting tools for Music Tuition Administration
Streamlined Operations: Music administration involves managing a vast amount of data related to lessons, staff, students, resources, and events. BI reporting tools help streamline these operations by providing a platform to access and analyse all your relevant information. Administrators can monitor the delivery of music lessons, track attendance, manage resources, and stay on top of important events, all within a single interface. This streamlining of operations leads to increased efficiency and improved overall administration.
Improved Resource Management: Efficient resource management is vital for local authority music services, private schools, hubs and for Teachers. BI reporting tools allow users to gain insights into resource utilization, such as the number of instruments on loan, resources in stock, or equipment maintenance requirements all in one dashboard. With this information at their fingertips, administrators can make informed decisions regarding resource allocation, ensuring that they have the necessary equipment and materials available when and where they are needed.
Data-Driven Decision Making: In the fast-paced world of music administration, making decisions based on data is crucial. BI reporting provides administrators with real-time and interactive visualizations that enable them to analyse current and historical data, identify trends, and make informed predictions for the future. For example, administrators can track student performance over time, identify areas of improvement, and tailor educational programs accordingly. Using BI reporting tools enables Data-driven decision making, enhancing the effectiveness of music programmes, contributing to the overall success of the organisation.
Enhanced Collaboration and Communication: BI reporting tools allow for administrators to share reports and dashboards with relevant stakeholders, fostering collaboration and improving communication within the music administration ecosystem. Your team, and management can access and analyse data simultaneously, ensuring everyone is on the same page and aligned with the organisation’s goals. The ability to share interactive reports with visualisations simplifies complex data, making it more accessible to all stakeholders, regardless of their technical expertise.
Challenges and Considerations
While BI reporting tools like Power BI offer numerous benefits, it is essential to consider potential challenges and limitations. One crucial aspect to address is data quality. The accuracy and completeness of data entered into Xperios, directly impacts the quality of insights derived from Power BI. Each service should establish standardized data entry processes, provide training to staff members, and conduct regular data validation to ensure the reliability of the data.
Moreover, implementing and integrating BI reporting tools such as Power BI within an organisation requires careful planning and technical expertise. Administrators should allocate sufficient time and resources for implementation, including training staff members on Power BI usage and leveraging the full potential of the tool. Check out Kevin Stratvert’s YouTube channel for great Power BI introduction and in depth videos. Additionally, ongoing maintenance and updates are necessary to keep the reporting system running smoothly and to incorporate any updates or improvements released by the BI reporting tools manufacturer.
Conclusion
In today’s data-driven world, BI reporting tools like Power BI have become indispensable for music services, private schools, and organizations. The seamless integration of BI reporting tools with Paritor’s Xperios music administration software empowers administrators to unlock the full potential of their data. From visualising and analysing music programme performance, to making informed decisions, BI reporting tools provide the tools necessary for success. By harnessing the power of BI reporting tools, music services can streamline their operations, improve resource management, and ultimately create better experiences for their students and stakeholders.
Remember, the data is in your hands. Let BI reporting tools and Xperios help you turn it into a symphony of insights. With Xperios, You Can!
#tuitionadministrationsystem #tuitionmanagementsystem #xperioscan #bireportingtools
Note: This blog post is for informational purposes only and does not constitute an endorsement or recommendation of Power BI or any specific reporting tool. Organizations should assess their unique needs and requirements before adopting any technology solution.